IBM SPSS · Watson Analytics · 2015
A non-confidential example of end-to-end UX work in a complex technical domain. As lead UX/UI designer at IBM SPSS, I designed a product to make statistical analysis accessible to business users, working with product, development, and SMEs from discovery through user-validated concepts.
A note on this project
"The technology is from 2015. The process is not. This is a non-confidential example of how I work: discovery, collaboration, and user validation in a technically complex domain."
Take yourself back to 2015: statistical software was powerful but impenetrable, designed for experts and largely inaccessible to the business users who needed it most.
Overview
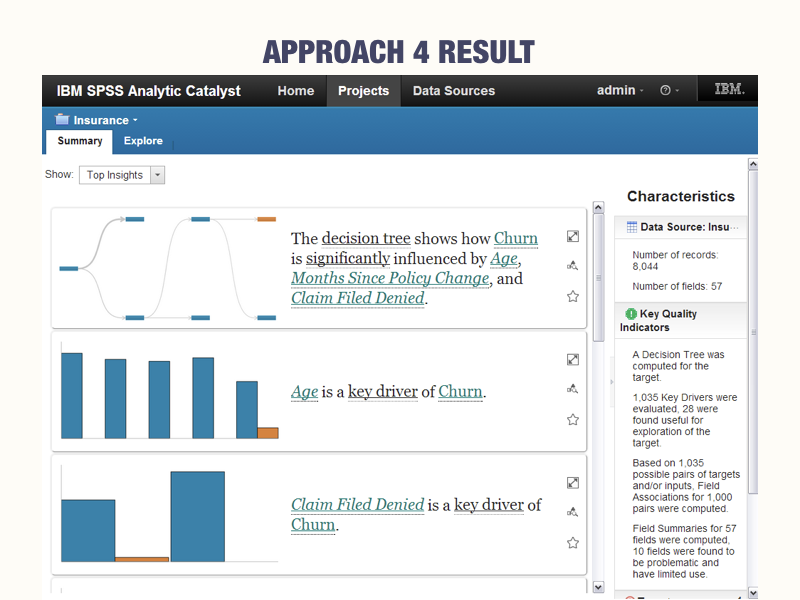
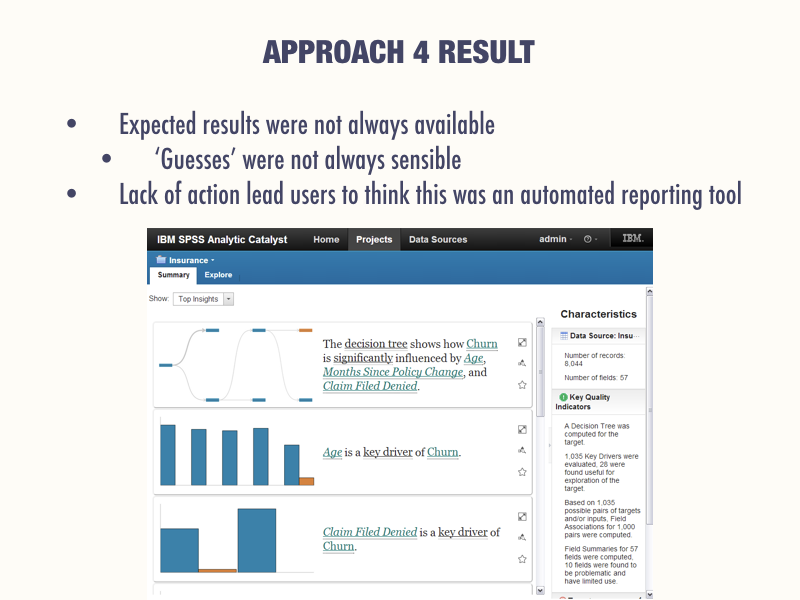
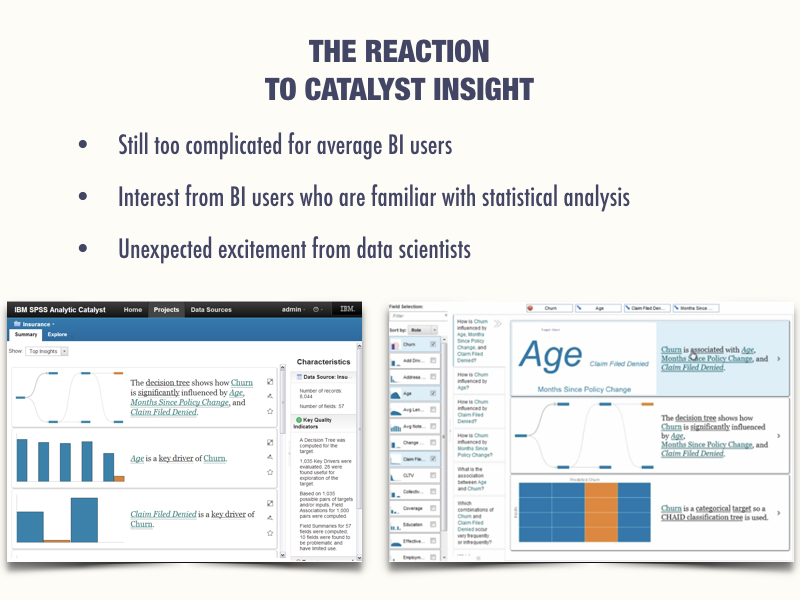
Existing statistical products were very complicated, focused more on test names than on utility. There was a deep gulf between people who understood statistical analysis and those who didn't. This is why we created Analytic Catalyst at IBM SPSS.
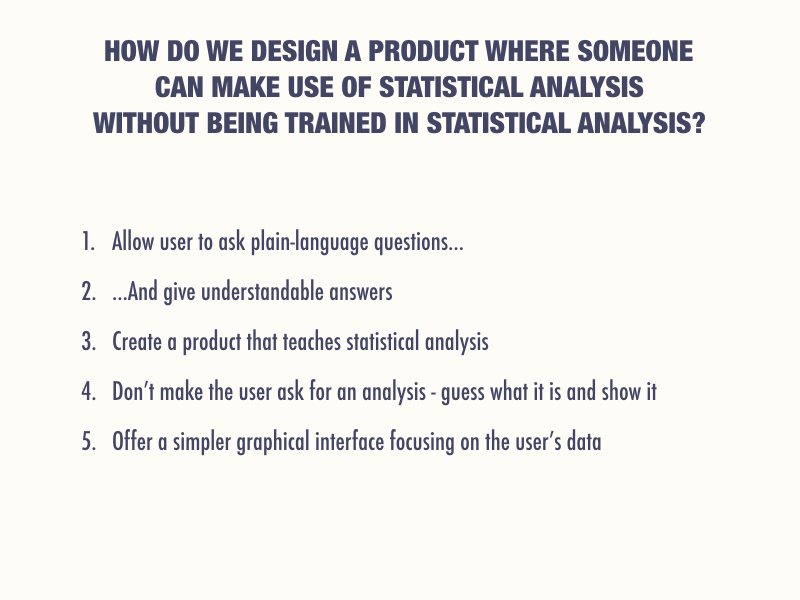
As the primary UX/UI designer, my goal was to design a product where business users could make use of statistical analysis without being trained in it, and carry those design concepts forward into the predictive portion of Watson Analytics.
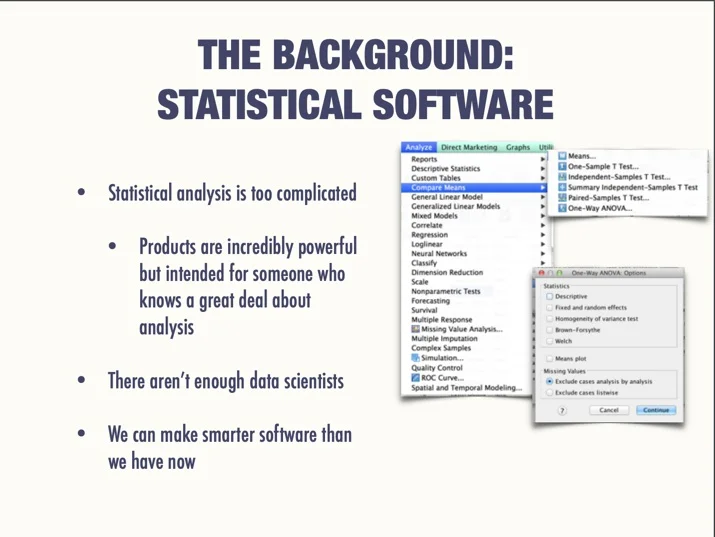
The problem space
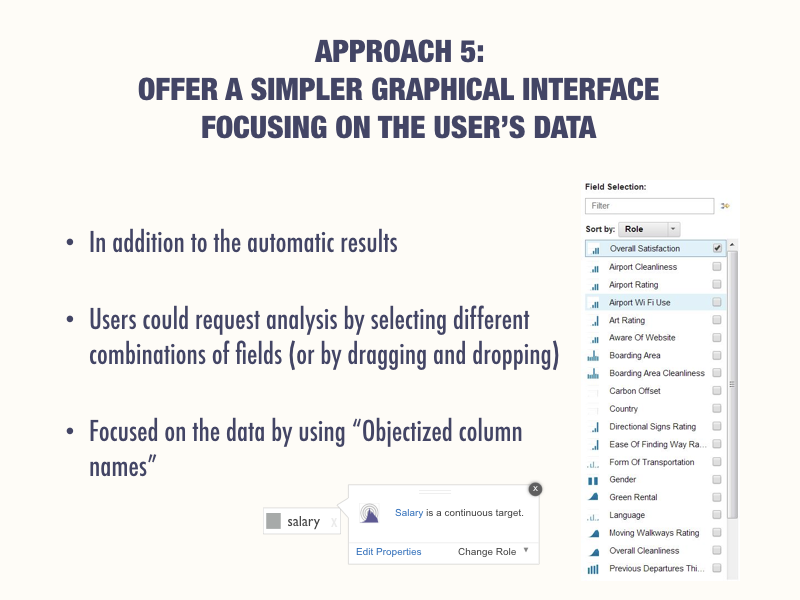
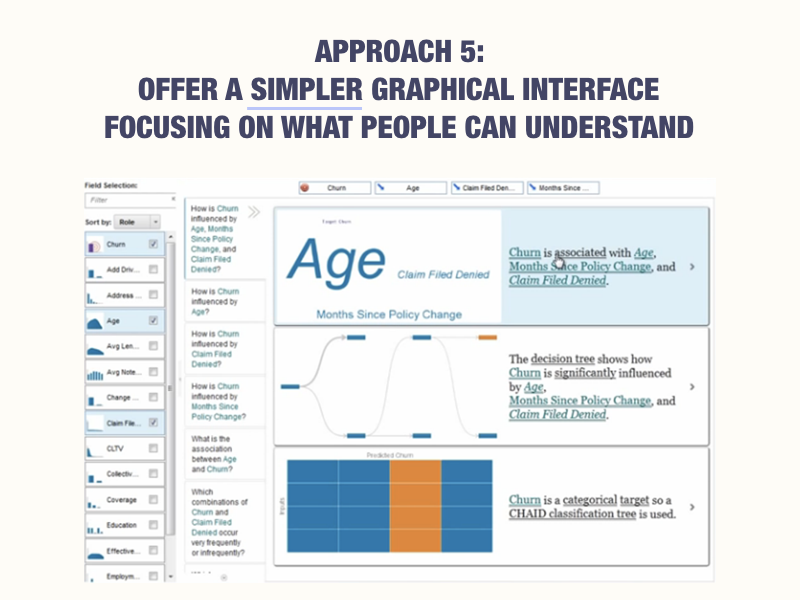
Statistical software of the era prioritized technical accuracy over user experience. Menus were organized by test name - meaningful to a statistician, but arcane to a business analyst trying to answer a straightforward question about their data.
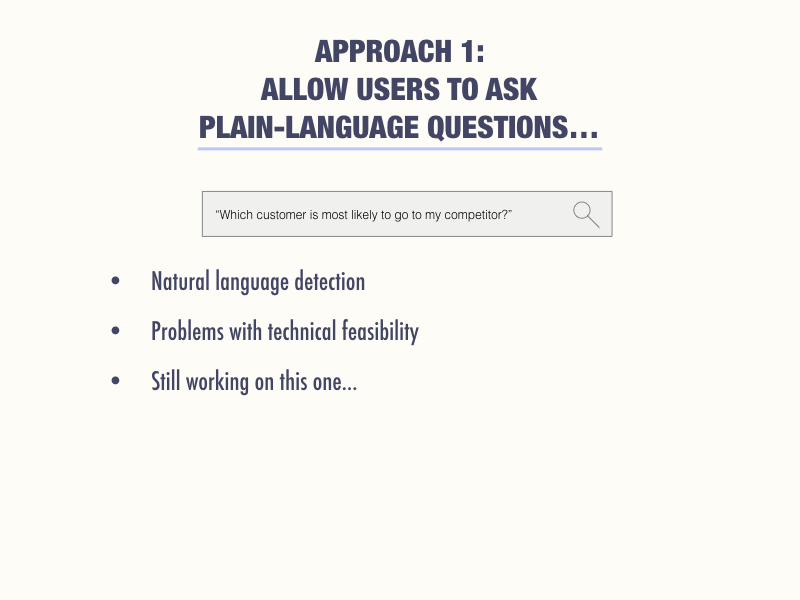
The opportunity was to reframe the product around the question the user was trying to answer, not the statistical method used to answer it.
Discovery & framing
Design process
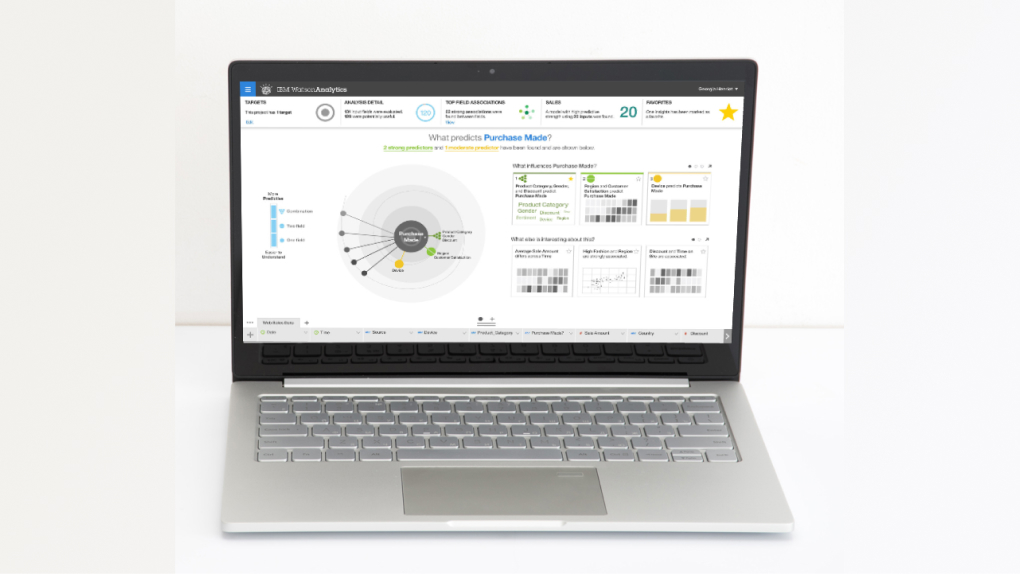
Watson Analytics
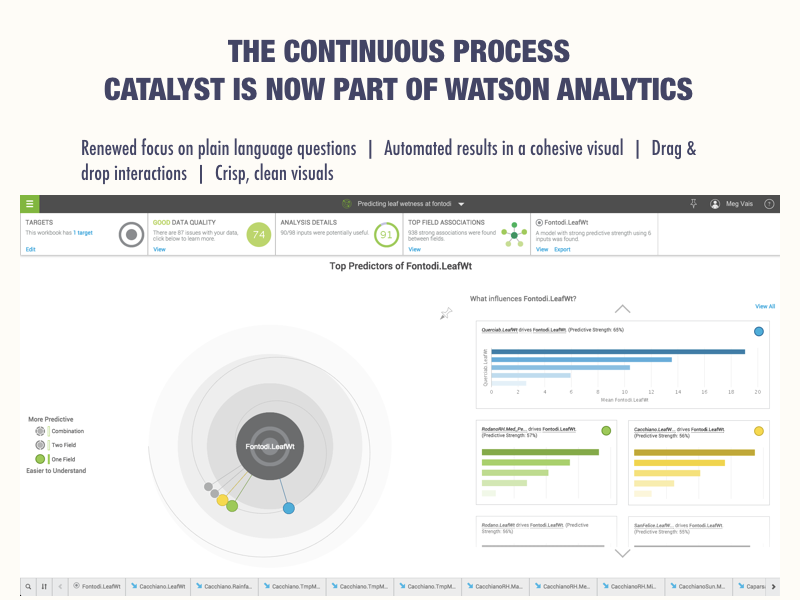
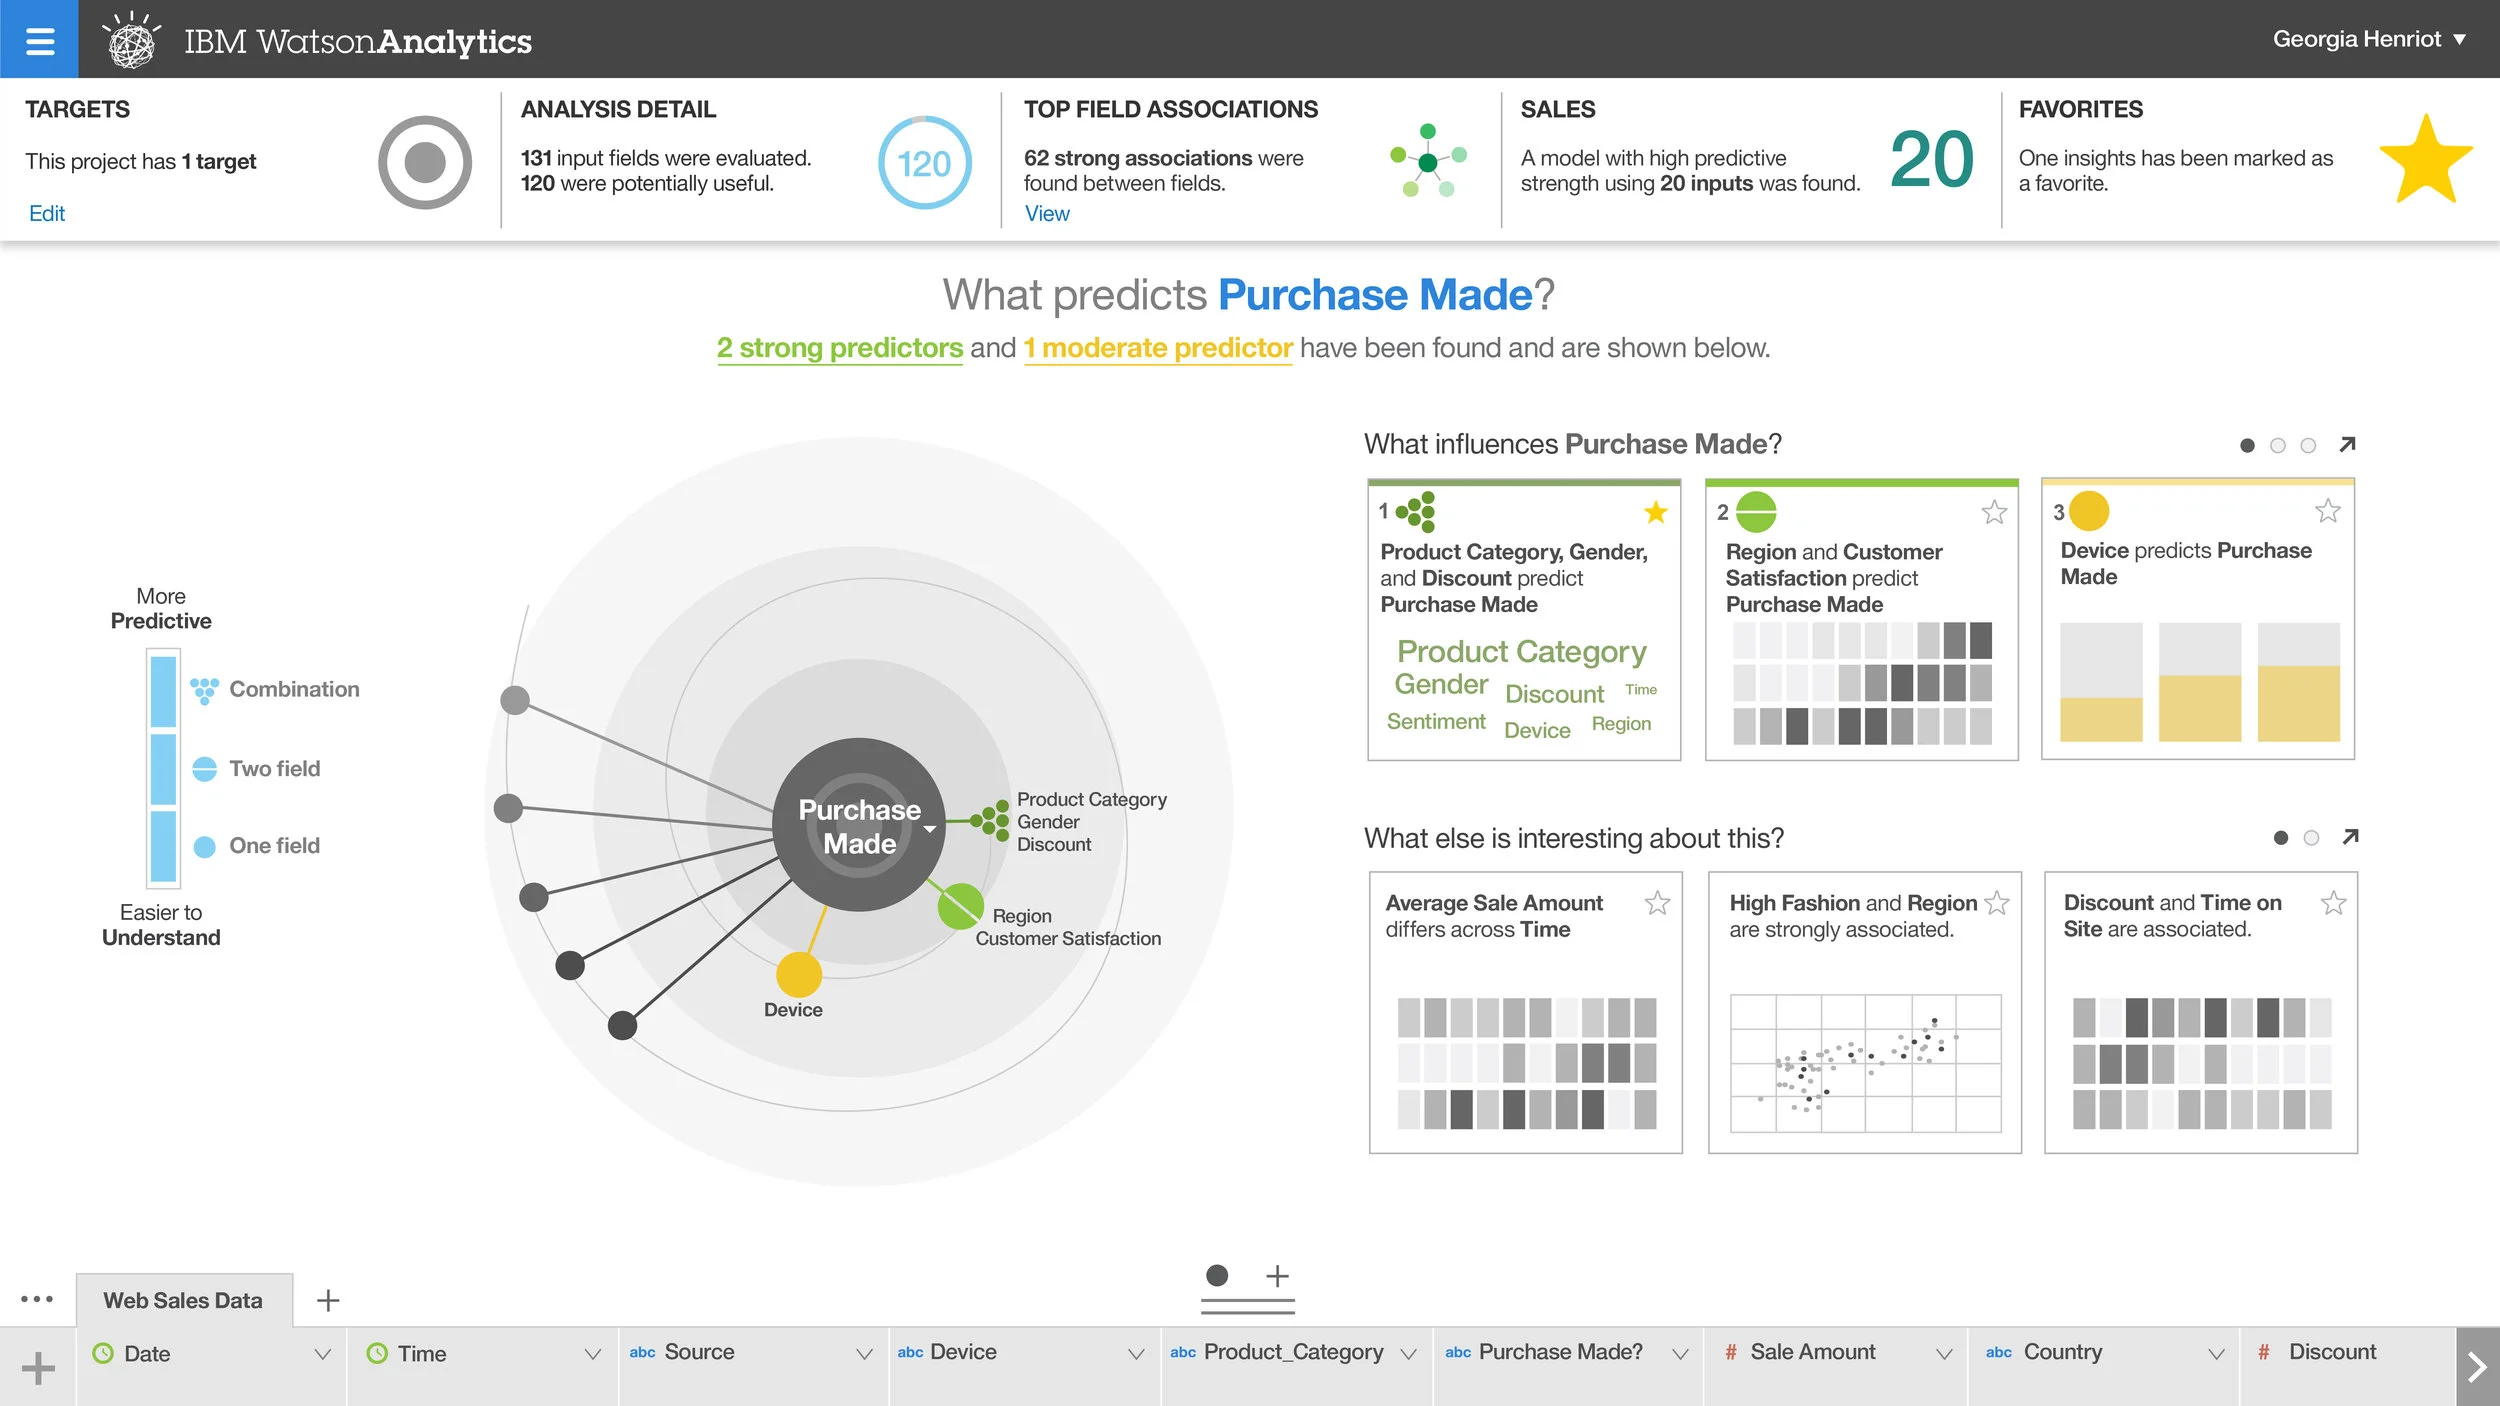
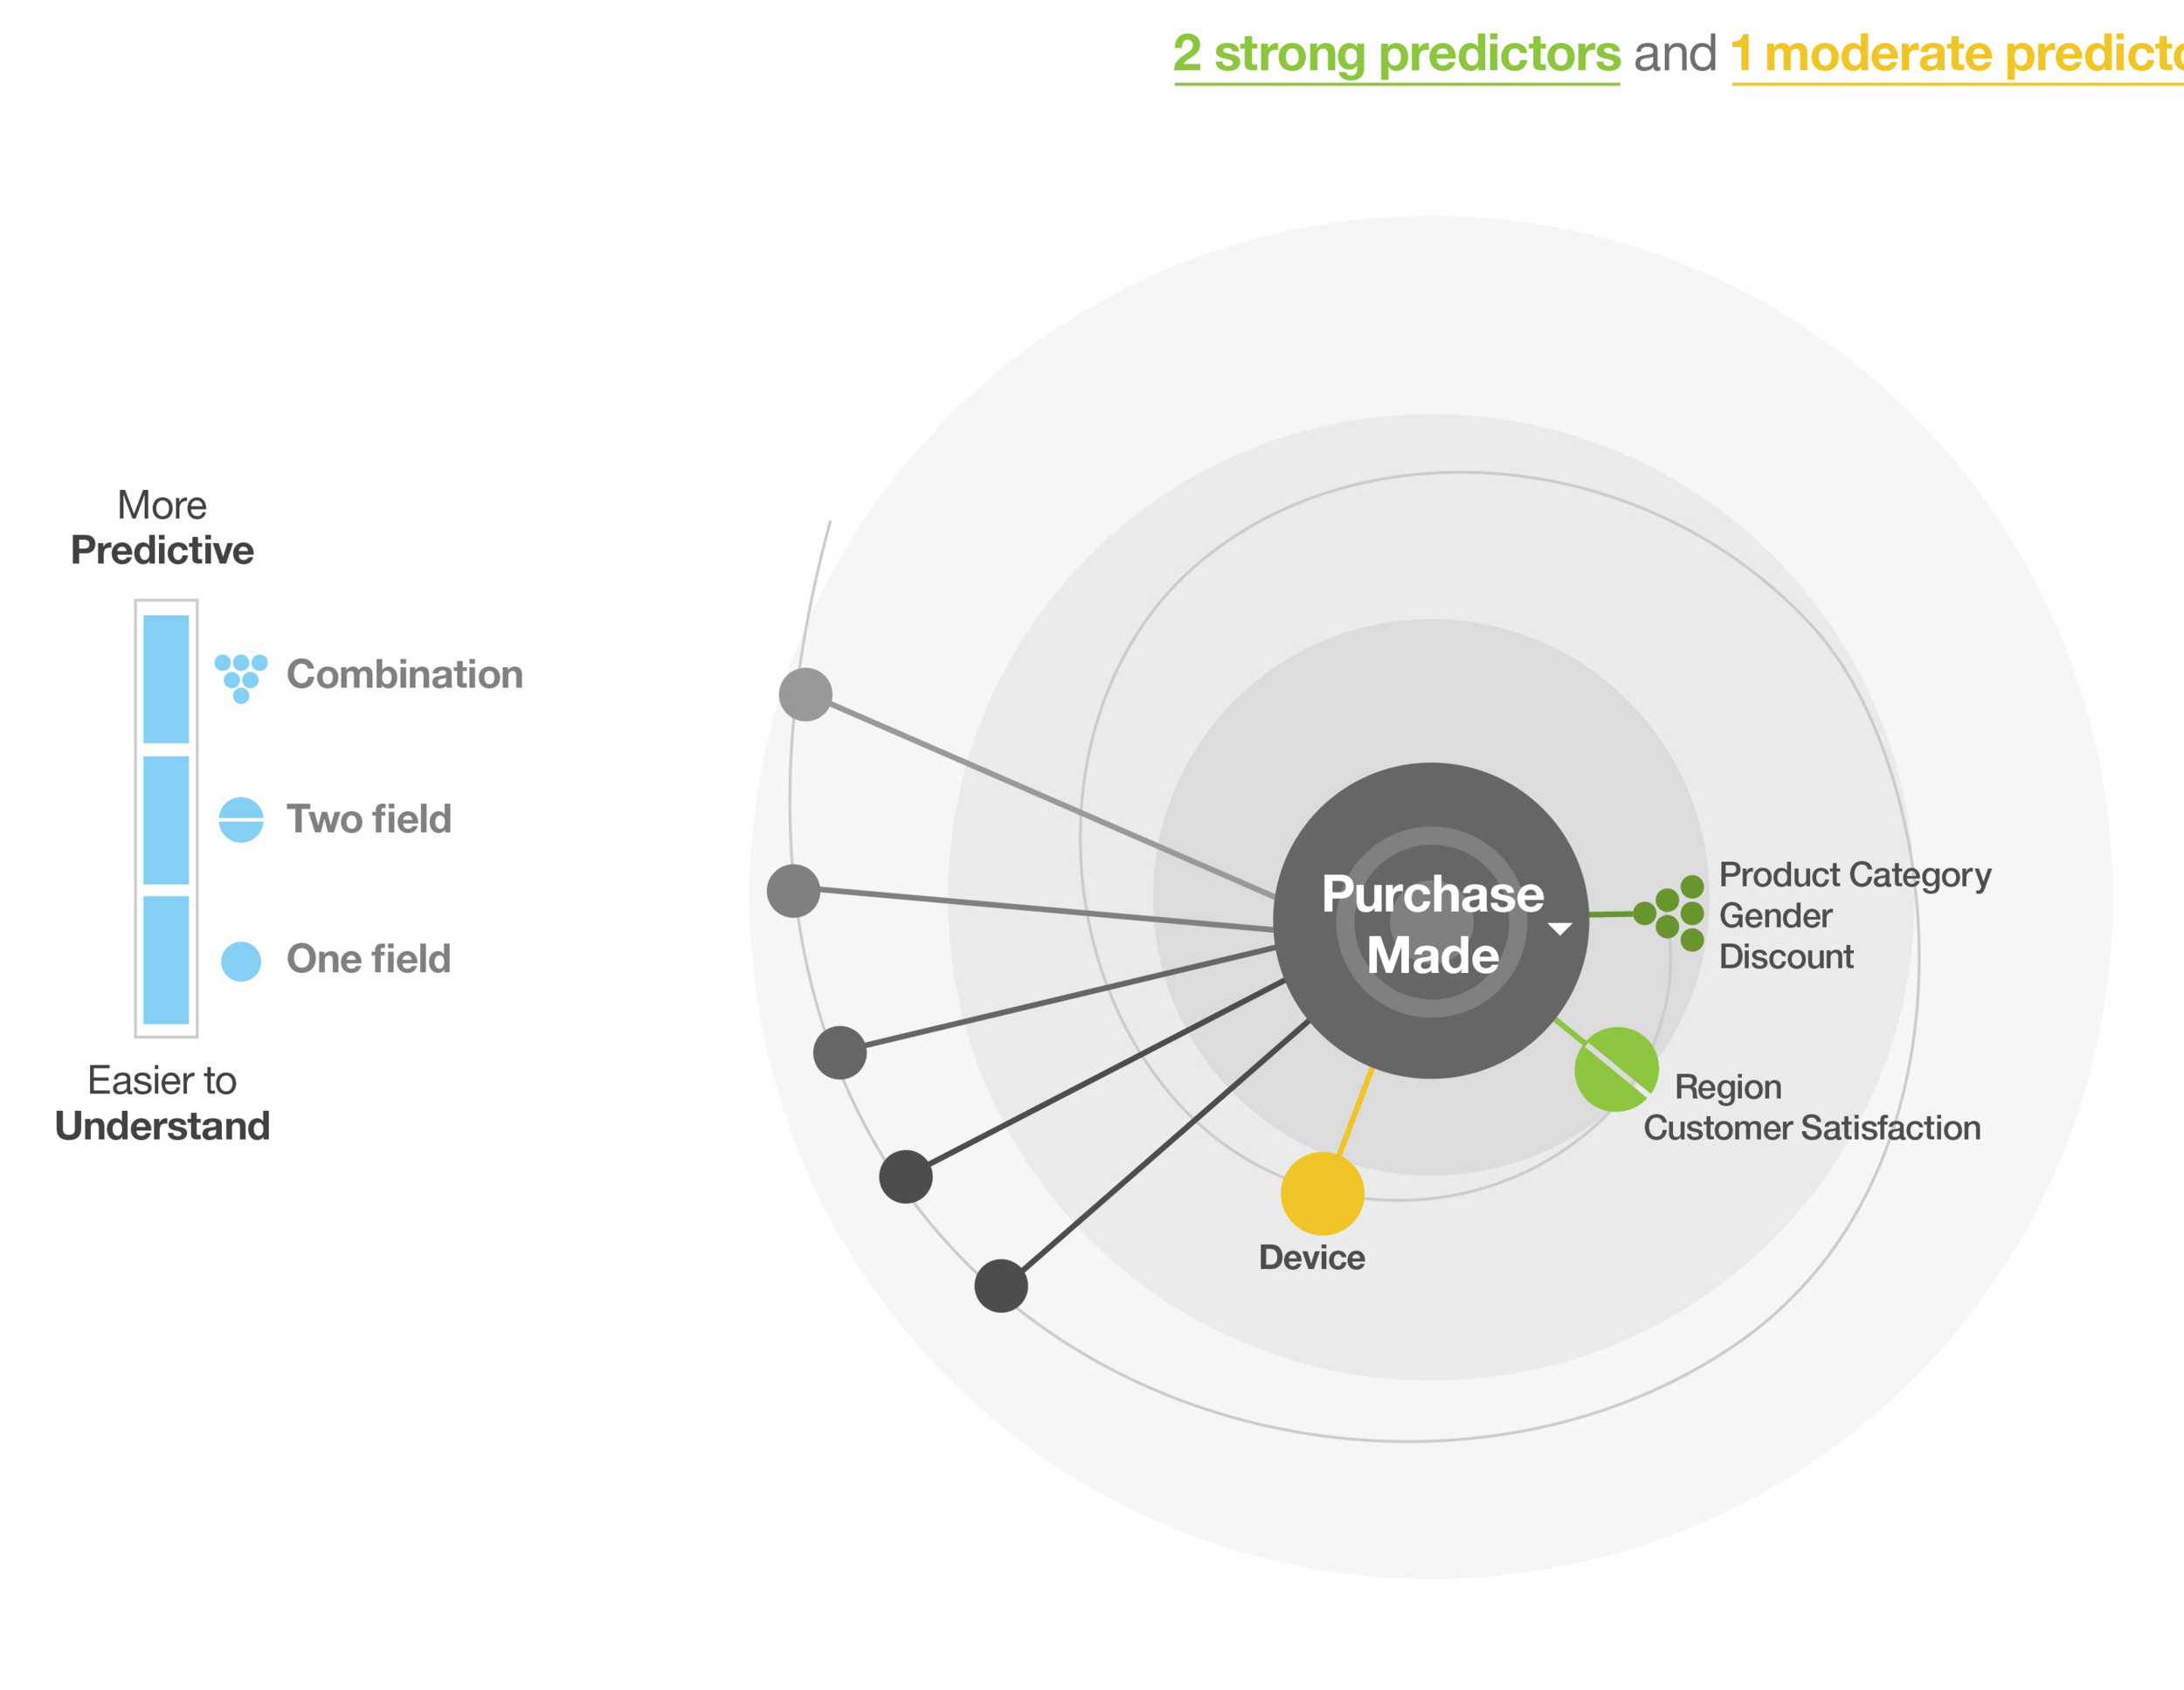
The concepts developed for Analytic Catalyst informed the predictive portion of Watson Analytics, IBM's next-generation analytics platform. The core design challenge remained the same: surface meaningful insight from complex data for users who aren't statisticians, without dumbing down the underlying analysis.
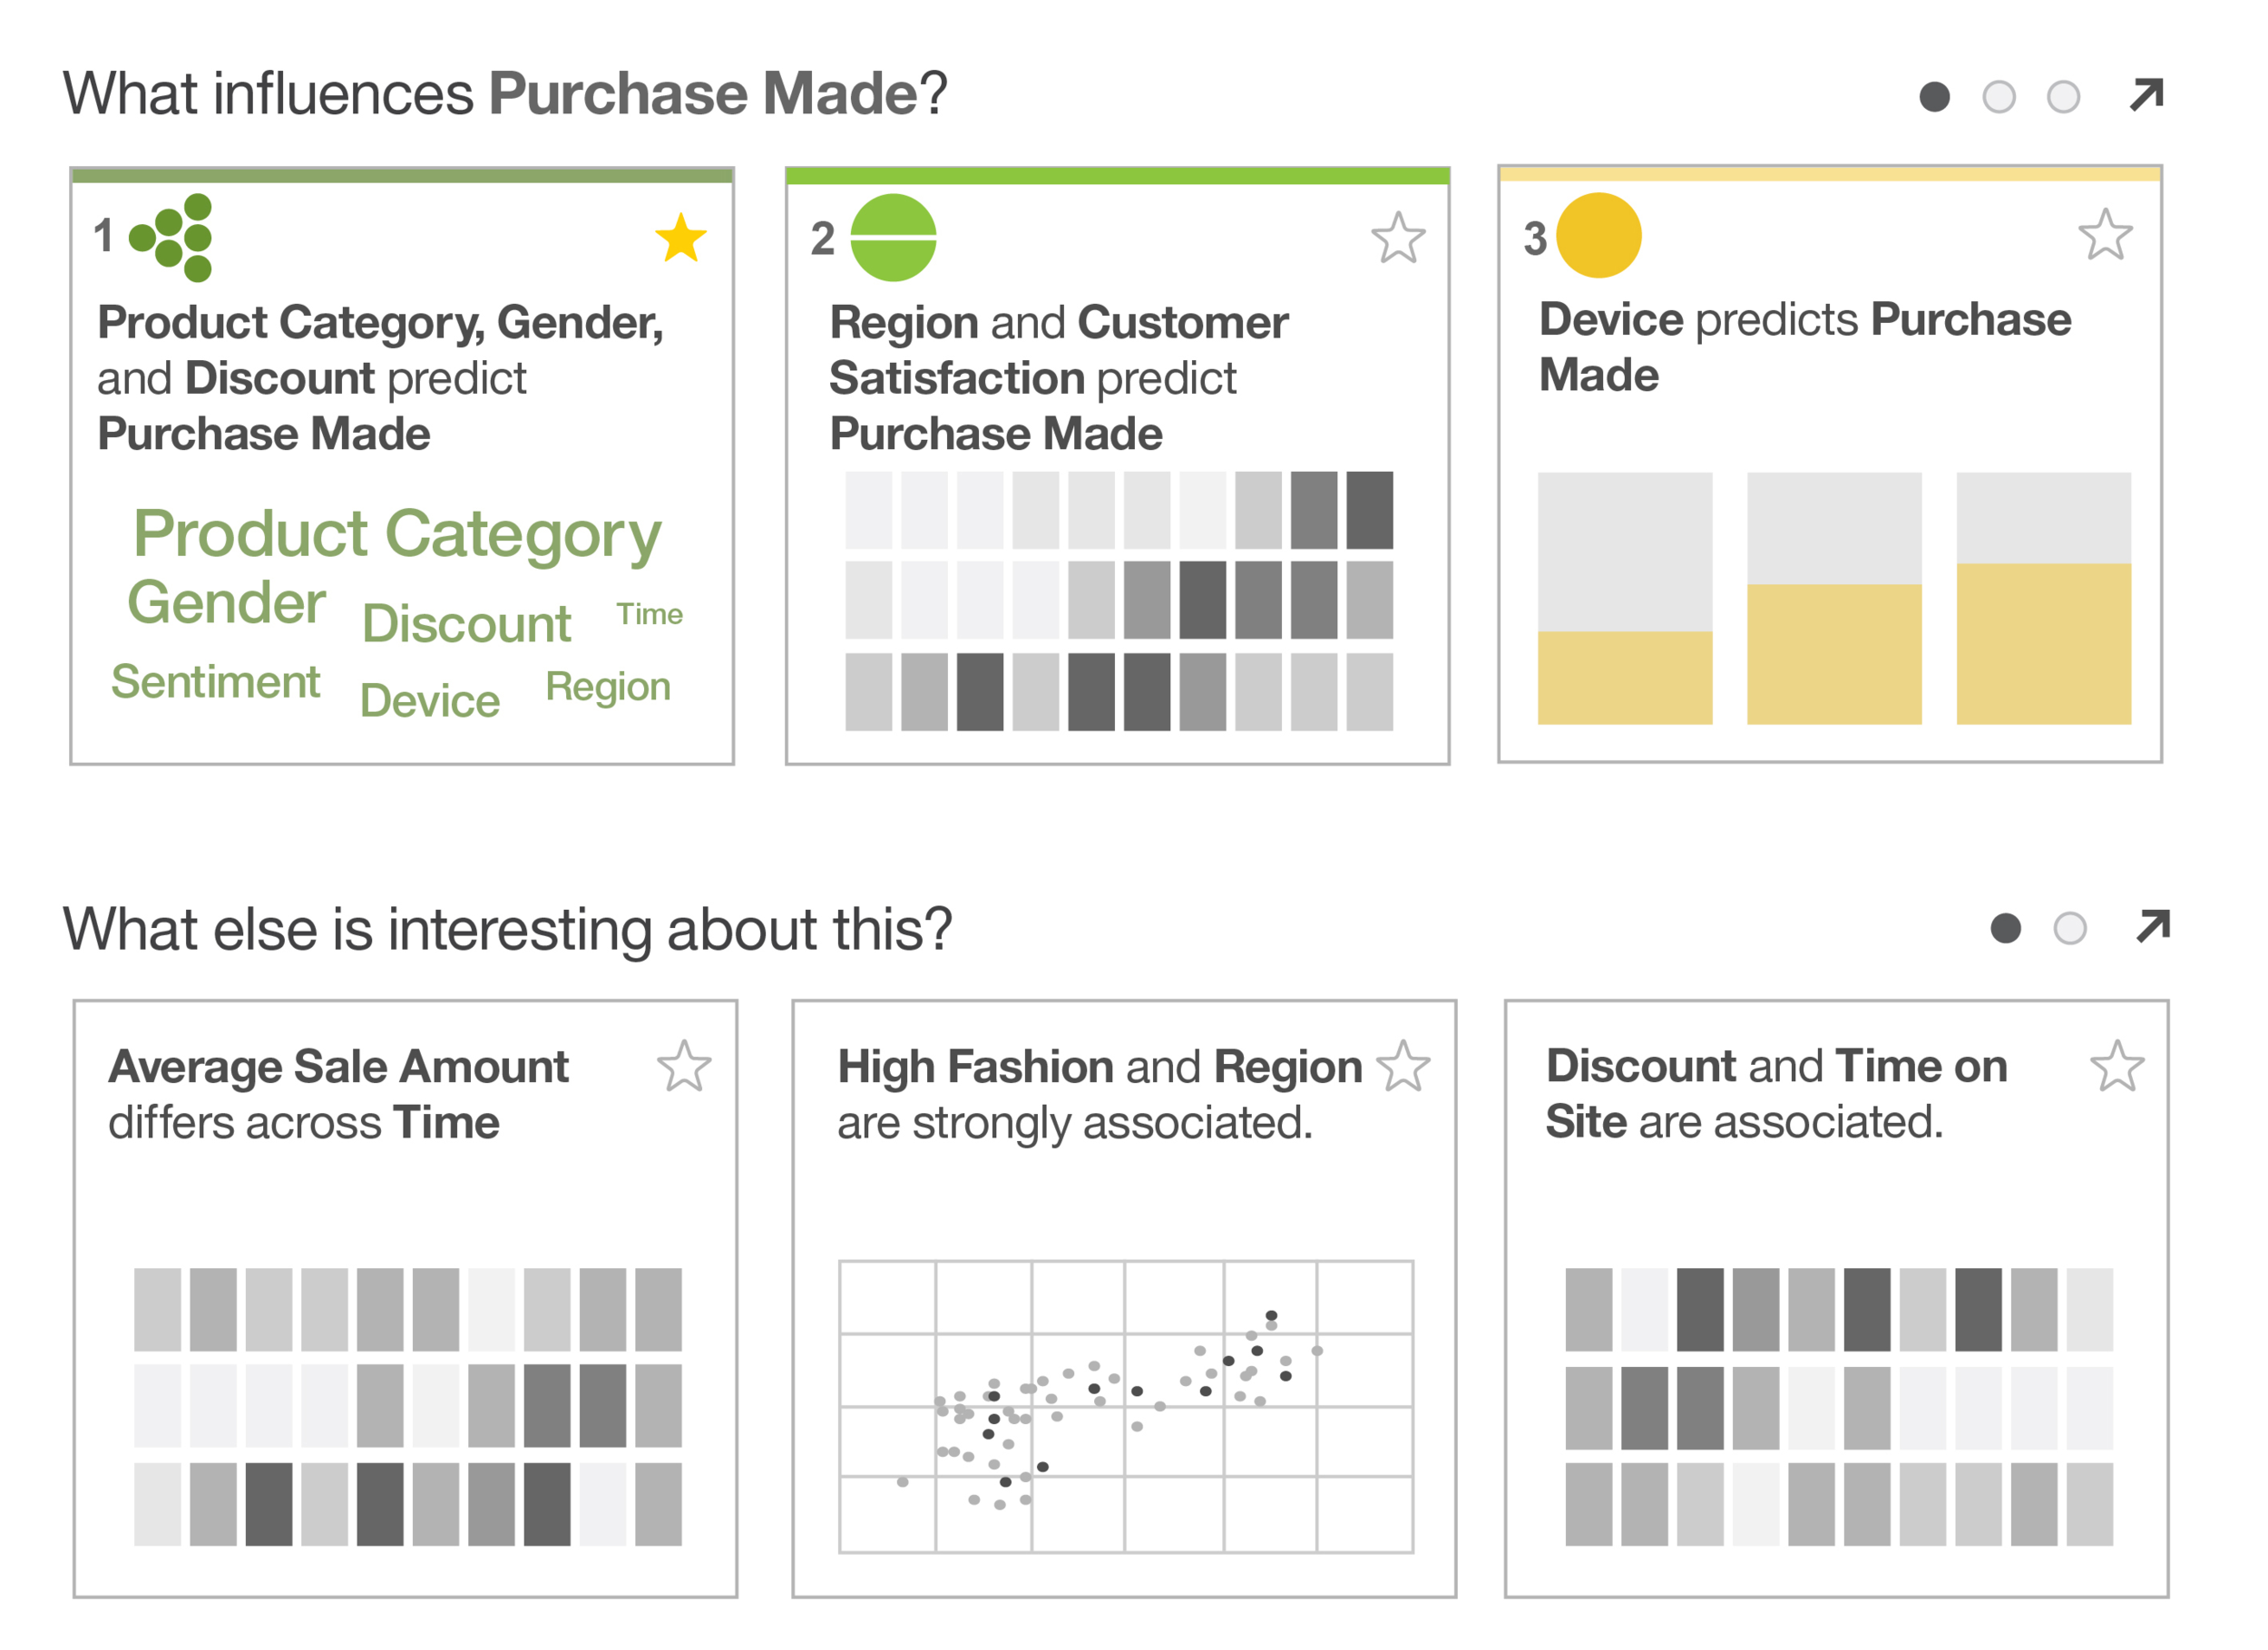
Watson Analytics dashboard
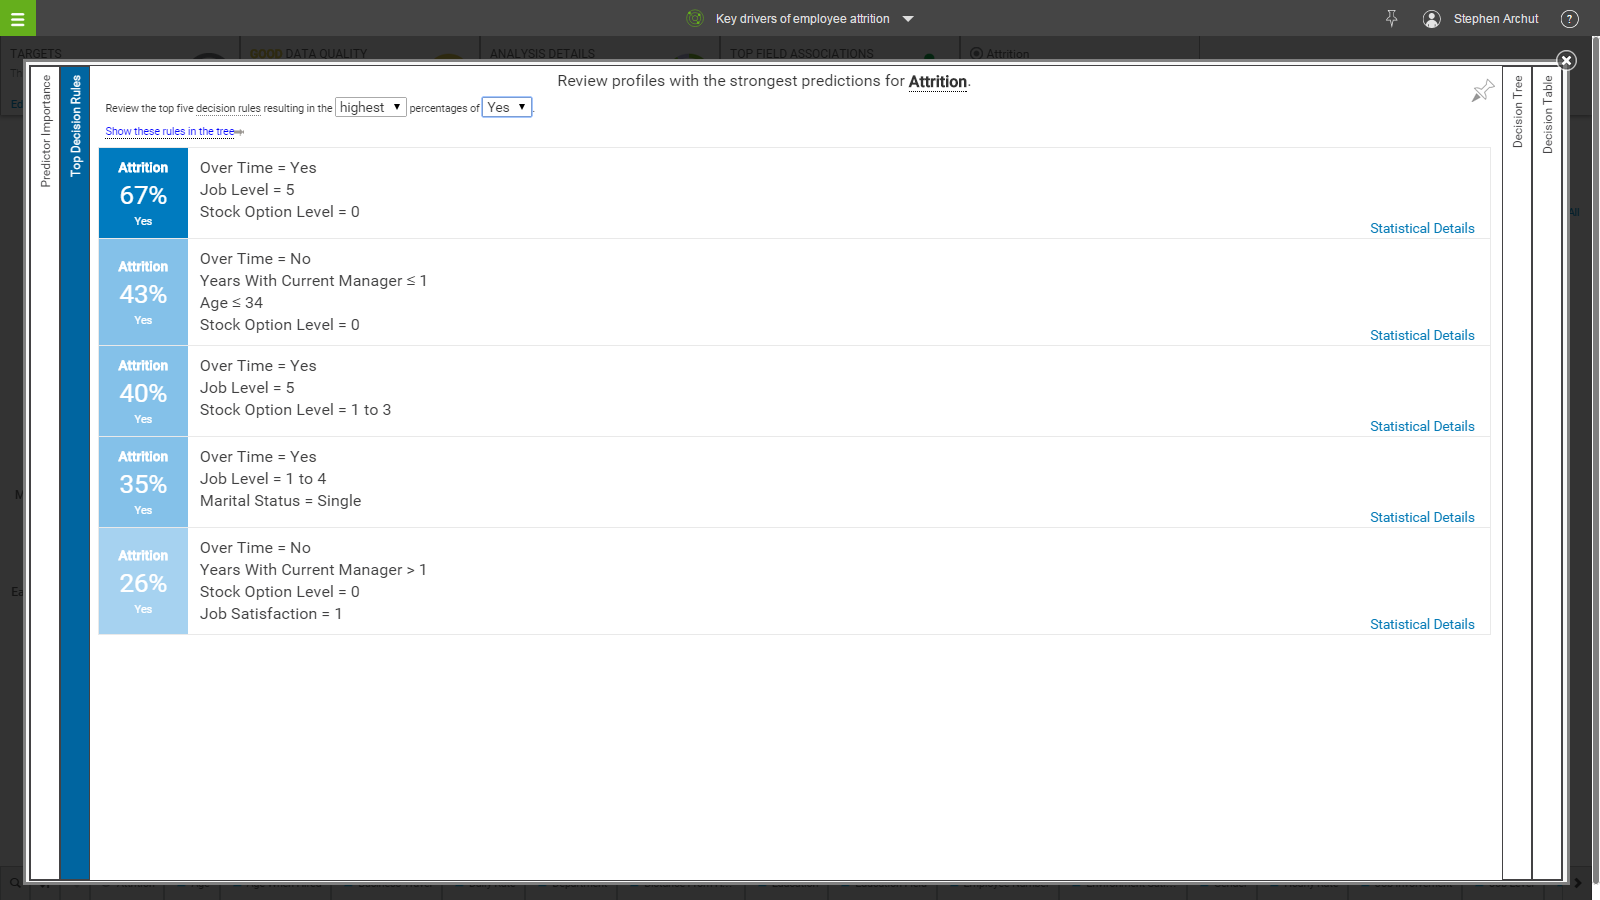
Predictive models
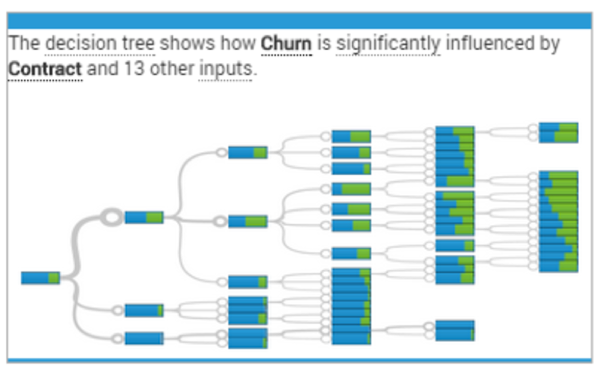
Decision tree
Outcome
2
Products shaped by this design process: Analytic Catalyst and Watson Analytics
0→1
New product category: statistical analysis for non-statisticians
✓
Validated with users across both products before shipping
The work shipped. The concepts moved from Analytic Catalyst into Watson Analytics and reached a broad audience of business users who would never have engaged with traditional statistical software. The process (discovery with SMEs, iterative concept development, user validation) is the part that hasn't aged.
Reflection
The technology is dated. The problem it addressed (making complex, expert-domain analysis accessible to everyday users) is as relevant as ever. In fact, it's exactly the problem AI is now solving at scale. Working in this space in 2015 gave me a strong foundation for thinking about how to design interfaces that sit between powerful underlying systems and users who don't need to understand how those systems work.
That framing shows up directly in how I think about AI-assisted design today: the interface should make the capability accessible without requiring the user to become an expert in the technology.